Supercomputing Subsurface Utility Maps

Where do we dig?
Decades of rapid development and re-development has caused the desynchronization of records on where underground utilities are located. In land scarce Singapore, it is becoming increasingly complicated to build new utilities, and there is a constant risk of hitting existing utilities, disrupting amenities and services to entire neighbourhoods.
With advances in key technologies, it has become possible to do subsurface utility mapping at scale and non-destructively – we can see more of the underground without digging. This explosion in the quantity as well as quality of data available to us has created new challenges in storing, processing, analysing, visualizing, and sharing underground information.
The National Supercomputing Centre (NSCC) High Performance Computing Innovation Challenge 2022 provided HSC Pipeline Engineering with a novel opportunity to explore all these new developments and test ways to stem the impeding data tide without breaking bank.
Solutioning with HPC
Ground penetrating radar (GPR) uses electromagnetic waves to profile what is underground. Assembling multiple GPRs into an array, mounting it on a vehicle, and pairing the system with a Global Navigation Satellite System Real-Time Kinematic (GNSS RTK) solution, has enabled HSC to canvas large swaths of road unobtrusively and reliably. Post-processing in software, layers upon layers of high-quality underground tomography is generated, giving indication of where utilities and other points of interest are.
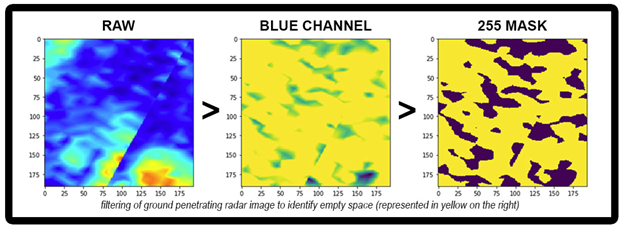
Reading the tomography is quite Intuitive – blues indicate empty space, while yellows and reds indicate occupied space. However, the data typically covers kilometres of area at a time, and it would be difficult for human technicians to consistently and accurately interpret the data into actionable information. Leveraging high performance computing, HSC uploaded these stacks of GPR imagery into NSCC’s peta-scale computer ASPIRE 1 and had the silicon processors classify billions of pixels as either TRUE for empty or FALSE for not empty. Combined with the latitude, longitude, and elevation geometry from the original subsurface tomography, an optimized 4-column dataframe was generated for further machine-based analysis.

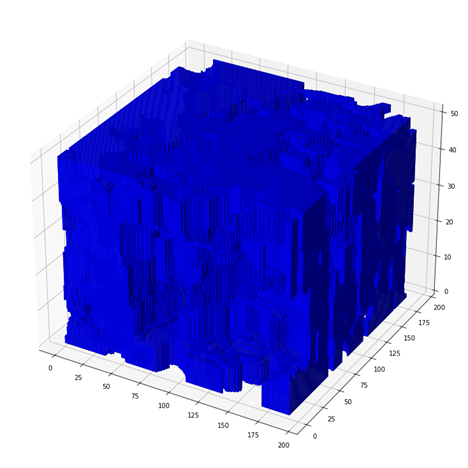
Specifying an area of interest, it then becomes possible to calculate the theoretical percentage of the underground that is still empty; by dividing the number of empty (TRUE) pixels by the total number of pixels in the selected volume. A low percentage implies that this part of the underground is at its limit, while a high percentage suggests capacity for future infrastructure development.

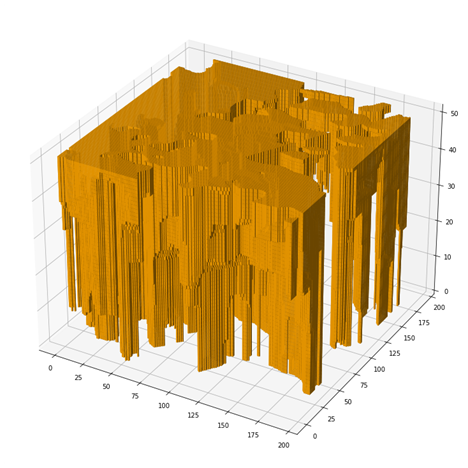
The geometry comes in play here to refine the analysis. By moderating percent available space by the first instance of a not empty pixel on the z-axis, HSC used high performance computing to calculate vertically (ie top-down) accessible space in an area. This provides a more realistic estimate of space availability by accounting for obstructions such as existing shallow infrastructure or geological oddities.

HSC is convinced that creating new guidance metrics such as percent available space and percent accessible space will allow stakeholders to make more informed decisions in urban planning, driving a higher level of subsurface utility mapping and engineering. Better due diligence is done upstream (planning) so that the downstream (construction, maintenance, recover) is not befouled by avoidable issues.
Decades of rapid development and re-development has caused the desynchronization of records on where underground utilities are located. In land scarce Singapore, it is becoming increasingly complicated to build new utilities, and there is a constant risk of hitting existing utilities, disrupting amenities and services to entire neighbourhoods.
With advances in key technologies, it has become possible to do subsurface utility mapping at scale and non-destructively – we can see more of the underground without digging. This explosion in the quantity as well as quality of data available to us has created new challenges in storing, processing, analysing, visualizing, and sharing underground information.
The National Supercomputing Centre (NSCC) High Performance Computing Innovation Challenge 2022 provided HSC Pipeline Engineering with a novel opportunity to explore all these new developments and test ways to stem the impeding data tide without breaking bank.
Solutioning with HPC
Ground penetrating radar (GPR) uses electromagnetic waves to profile what is underground. Assembling multiple GPRs into an array, mounting it on a vehicle, and pairing the system with a Global Navigation Satellite System Real-Time Kinematic (GNSS RTK) solution, has enabled HSC to canvas large swaths of road unobtrusively and reliably. Post-processing in software, layers upon layers of high-quality underground tomography is generated, giving indication of where utilities and other points of interest are.
Reading the tomography is quite Intuitive – blues indicate empty space, while yellows and reds indicate occupied space. However, the data typically covers kilometres of area at a time, and it would be difficult for human technicians to consistently and accurately interpret the data into actionable information. Leveraging high performance computing, HSC uploaded these stacks of GPR imagery into NSCC’s peta-scale computer ASPIRE 1 and had the silicon processors classify billions of pixels as either TRUE for empty or FALSE for not empty. Combined with the latitude, longitude, and elevation geometry from the original subsurface tomography, an optimized 4-column dataframe was generated for further machine-based analysis.

Specifying an area of interest, it then becomes possible to calculate the theoretical percentage of the underground that is still empty; by dividing the number of empty (TRUE) pixels by the total number of pixels in the selected volume. A low percentage implies that this part of the underground is at its limit, while a high percentage suggests capacity for future infrastructure development.

The geometry comes in play here to refine the analysis. By moderating percent available space by the first instance of a not empty pixel on the z-axis, HSC used high performance computing to calculate vertically (ie top-down) accessible space in an area. This provides a more realistic estimate of space availability by accounting for obstructions such as existing shallow infrastructure or geological oddities.

HSC is convinced that creating new guidance metrics such as percent available space and percent accessible space will allow stakeholders to make more informed decisions in urban planning, driving a higher level of subsurface utility mapping and engineering. Better due diligence is done upstream (planning) so that the downstream (construction, maintenance, recover) is not befouled by avoidable issues.
Aug 02,2024
